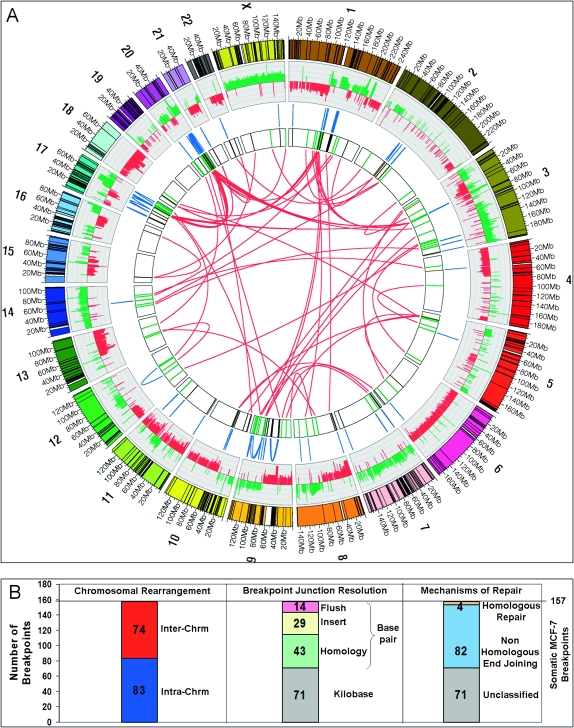
Figure 2.
(A) Circular visualization of the MCF-7 genome obtained using Circos software. Chromosomes are individually colored with centromeres in white and LCR regions in black. MCF-7 BAC array comparative genome hybridization data (Jonsson et al. 2007) are plotted with gains in green and losses in red using log2ratio. The inner chromosome annotations depict 157 somatic MCF-7 breast tumor chromosomal rearrangements associated with LCRs (black) and breakpoints not associated with LCRs (green). Chromosomal rearrangements are depicted on each side of the MCF-7 breakpoints; intrachromosomal rearrangements (blue) are located outside and interchromosomal rearrangements (red) are located in the center of the circle. (B) Bar charts indicating classification of somatic breakpoints in MCF-7.

