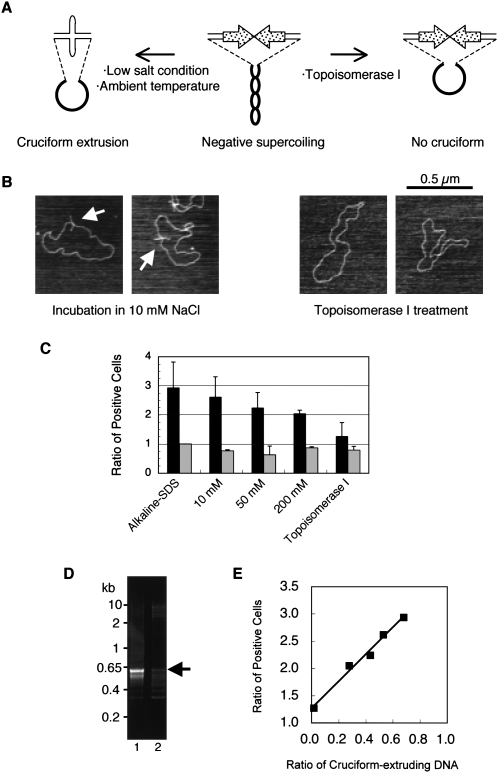
Figure 4.
Translocation-like rearrangements induced by cruciform DNA. (A) Cruciform extrusion of the PATRR in plasmids with negative superhelicity. (Middle) The plasmid purified from E. coli is negatively supercoiled. In low salt conditions, a PATRR plasmid with negative superhelicity energetically favors cruciform extrusion forming intrastrand base-pairing at ambient temperature. (Left) The positive free energy of cruciform formation is offset by relaxation of the negative superhelical density. (Right) If the negative superhelicity is abrogated by topoisomerase I prior to cruciform extrusion, relaxed plasmid without extruded cruciform can be obtained. (B) AFM image of the 22-SA-GFP plasmid. Plasmid DNA purified by the Triton method was incubated in 10 mM NaCl (left) or treated with topoisomerase I (right) and observed by AFM. (Arrows) Cruciform extrusion of the PATRR plasmids. (C) The incidence of translocation-like rearrangements reflects the method of preparation for the PATRR plasmids. The numbers of GFP-positive cells were enumerated after co-transfection with various 22-SA-GFP plasmid topoisomers and cruciform-extruding P-SD-11. The plasmid topoisomers were prepared by the alkaline-SDS method and by the Triton method followed either by incubation in various NaCl concentrations or by topoisomerase I treatment. (Left bars, black) The results of 22-SA-GFP with the P-SD-11 plasmid; (right bars, gray) results of 22-SA-GFP with the P-SD-11del plasmid. (Vertical scale) The ratio of values relative to that obtained for the 22-SA-GFP isolated by the alkaline-SDS method with the P-SD-11del. Bars, SD (n = 3). (D) Rearrangement-specific PCR. Cruciform-extruding 22-SA-GFP obtained by the alkaline-SDS method (lane 1) or non-cruciform 22-SA-GFP obtained by the Triton method followed by topoisomerase I treatment (lane 2) were transfected with cruciform-extruding P-SD-11 for 48 h. In contrast to the strong band in the cruciform-positive sample (arrow), only a faint band was observed with non-cruciform DNA. (E) Proportional relation between cruciform extrusion and rearrangement frequency. The degrees of cruciform extrusion observed by AFM correlate with the ratio of GFP-positive cells (r = 0.992, P = 0.0008).

