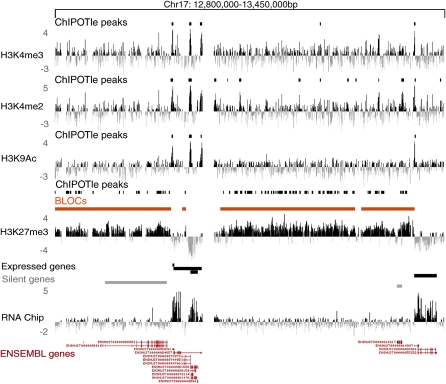
Figure 1.
H3K27me3 forms BLOCs covering silent genes and intergenic regions. A screen shot from the UCSC genome browser showing the distribution of histone modifications across a 650 kb region of mouse chr 17 (UCSC Mouse [mm6], March 2005) in mouse embryo fibroblasts (MEFs). Profiles for three active histone modifications (H3K4me3, H3K4me2, and H3K9Ac) and the repressive H3K27me3 are displayed. Active histone modifications form peaks detected by ChIPOTle (Buck et al. 2005) (short black bars), while H3K27me3 spreads over large regions (orange bars) called BLOCs (broad local enrichments) that are also detected as dense clusters of ChIPOTle peaks. Expression was determined by hybridizing polyA RNA to the tiling array (RNA chip track). Black and gray bars above the RNA chip track represent, respectively, expressed and silent genes (Supplemental Fig. 4). Positions of genes are shown by Ensembl predictions. Y-axis: log2 ChIP/input ratio or cDNA/input. X-axis: 50 bp oligonucleotides from repeat-masked sequence included on the NimbleGen custom mouse chr 17 tiling array.

