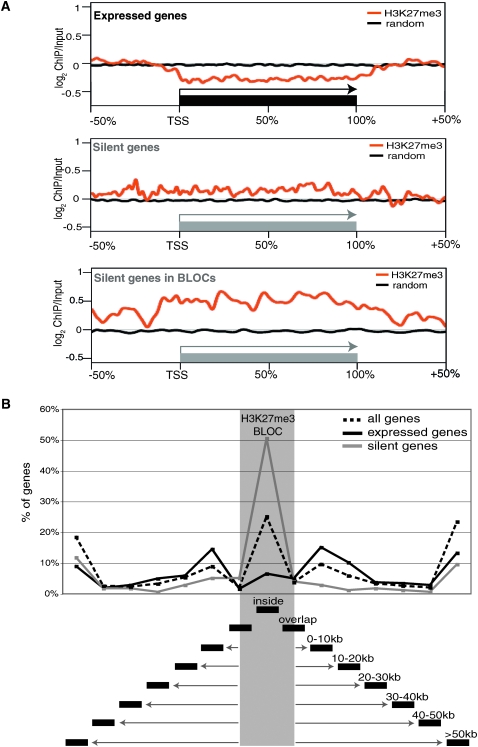
Figure 3.
Silent and expressed genes cluster close to H3K27me3 BLOCs. (A) The combined log2 ChIP/input ratios from one MEFF chr 17 ChIP-chip replicate are shown for all expressed genes (top) all silent genes (middle), and silent genes in BLOCs (bottom) relative to the transcription start site (TSS), gene length, and flanking regions. All positions are relative and the length of the gene (black box: expressed/gray box: silent) is defined as 100% and the flanking regions are ±50% of the gene length. Orange line: continuous log2 ChIP/input values, black line: randomized data set. (B) The graph indicates the distance of all genes (dotted line) or of expressed (black line) or silent (gray line) genes relative to the closest H3K27me3 BLOC (gray shaded area) in the MEFF cell line. Distances were calculated separately for each gene and then combined into distance bins (black boxes underneath). The percentage of genes in each bin is indicated on the y-axis. Silent genes are inside and expressed genes are outside, but close to H3K27me3 BLOCs.

