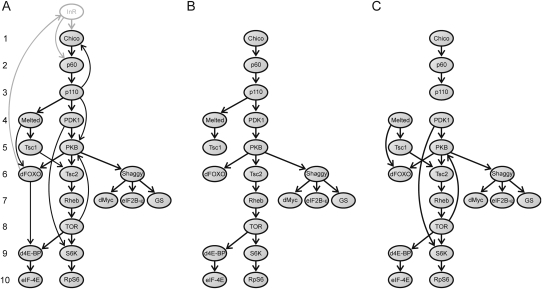
Figure 2.
Graphs used in the network-level analysis. (A) Directed graph (G graph) representing the interactions across the D. melanogaster IT pathway elements. Arrows (arcs) indicate the direction of signal transduction. Numbers on the left represent the position of the elements in the pathway. (B) Graph T is a directed spanning tree of G used to compute the position of each element in the IT pathway (i.e., the number of signal transduction steps required to transduce the signal from InR to the downstream elements of the pathway). This graph was obtained by removing some arcs from G (according to specific biochemical criteria). We eliminated the three arcs involving feedback loops (activation of Chico by PIP3, which is synthesized by p110; activation of InR by the transcription factor dFOXO; phosphorylation of PKB by TOR). Furthermore, if a particular node is reached by different paths (d4E-BP, dFOXO, PKB, S6K, and Tsc2) we considered only one of them. For dFOXO, PKB, and S6K, we chose the longest path, since each of the paths allows the transduction of one necessary but not sufficient signal for the activation/inhibition of these proteins (i.e., the elements need to receive all the signals for activation/inhibition). Indeed, the recruitment of dFOXO to the cell membrane by Melt is a prior step to the phosphorylation (and consequent inhibition) of dFOXO by PKB (the Akt1 product). In the same way, the recruitment of PKB to the cell membrane through its interaction with PIP3 (synthesized by p110) is also a prior step to the phosphorylation of PKB by PDK1 (the Pk61C product). S6K needs to be phosphorylated by both PDK1 and TOR for full activation (Chou and Blenis 1995; Dufner and Thomas 1999; Avruch et al. 2001). d4E-BP (the Thor encoded protein) is an inhibitor of the pathway activated by its transcription factor dFOXO and inhibited by the TOR kinase. Given that only the second interaction activates the pathway, we eliminated the first from the analysis. (C) Graph S is a subgraph of G that includes only the direct physical PPIs between the elements of the IT pathway.

