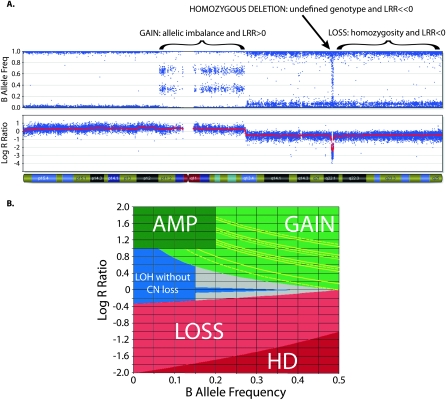
Figure 1.
Copy number (CN) determination using B allele frequency (BAF) and Log R ratio (LRR) across a single chromosome of a primary neuroblastoma. (A) A chromosome is displayed, from the short arm on the left to the long arm on the right. (Top plot) BAF values range from 0 to 1: areas of homozygosity have BAF of 0 or 1; normal diploid regions have BAF of 0, 0.5, or 1; areas of allelic imbalance show intermediate values; homozygous deletions have no detectable signal so the calculated BAF appears as noise. (Bottom plot) LRR values of 0 represent two copies with lower values in areas of loss and higher values in areas of gain. (B) Illustrates how CN is determined using LRR as a function of BAF. Each SNP window has a median LRR and median BAF, which fall in a colored zone in the plot; CN is then calculated based on the BAF for (green zone) gains and (red zone) losses. Gains can further be characterized by their number of minor alleles (NOMA). The yellow lines outline call zones for NOMA 1 (lowest LRR) to NOMA 4 (highest LRR). (Blue zone) Homozygous SNPs whose LRR is not consistent with loss have CN of 2 or higher with LOH; those CN are calculated based on the LRR. CN for amplifications (AMP) is also based on the LRR, while homozygous deletions (HD) have CN of 0. SNPs that fall in the gray zone are undetermined; CN is determined by interpolation.

