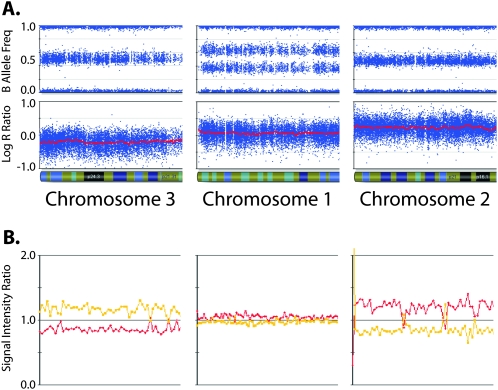
Figure 3.
Aneuploidy affects chip-wide normalization. Data from three chromosome arms from a near-triploid neuroblastoma sample (DNA index = 1.43) assayed on the SNP array (A) as well as on a BAC-based aCGH platform (B). The leftmost chromosome shows decreased LRR and aCGH intensity ratio; the middle chromosome shows “normal” baseline LRR and aCGH intensity ratio; the rightmost chromosome shows increased LRR and aCGH intensity ratio. These intensity values imply CN = 1 for chromosome 3, which is inconsistent with the presence of heterozygous SNPs (BAF of 0.5). The LRR values would also imply CN = 2 for chromosome 1, which is inconsistent with the allelic imbalance seen in the BAF plot.

