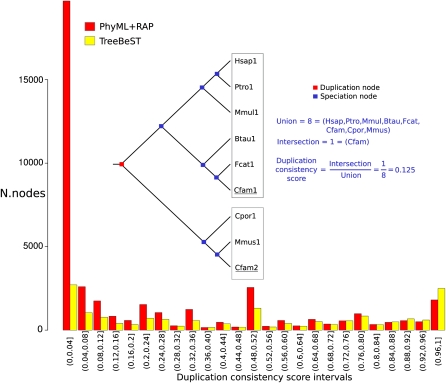
Figure 2.
A diagram of the duplication consistency score on an example tree showing unlikely coordinated deletions on the subsequent lineages. The histogram shows the distribution of consistency scores for both PhyML/RAP and TreeBeST methods. PhyML/RAP has both a higher absolute number of duplications and far more at low consistency values.

