Table 1.
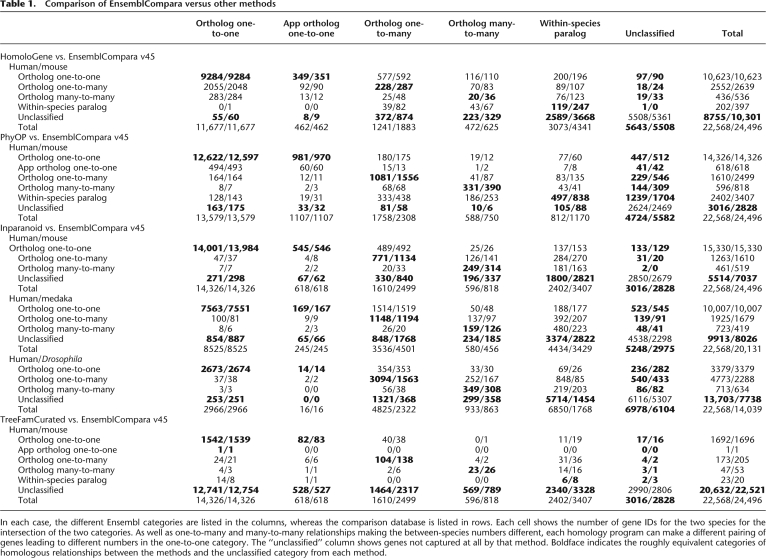
Comparison of EnsemblCompara versus other methods
In each case, the different Ensembl categories are listed in the columns, whereas the comparison database is listed in rows. Each cell shows the number of gene IDs for the two species for the intersection of the two categories. As well as one-to-many and many-to-many relationships making the between-species numbers different, each homology program can make a different pairing of genes leading to different numbers in the one-to-one category. The “unclassified” column shows genes not captured at all by that method. Boldface indicates the roughly equivalent categories of homologous relationships between the methods and the unclassified category from each method.

