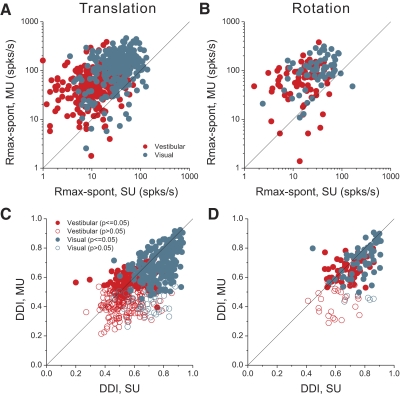
FIG. 5.
Quantitative summary of peak response (Rmax − spont) and tuning strength (direction discrimination index [DDI]) derived from MU and SU responses. In each panel, data from SUs are plotted on the x-axis and data from the corresponding MU responses are plotted on the y-axis. Red and cyan symbols represent data from vestibular and visual conditions, respectively. A: comparison of SU and MU peak responses for the vestibular translation (n = 287) and visual translation (n = 272) conditions. B: comparison of SU and MU peak responses for the vestibular rotation (n = 81) and visual rotation (n = 66) conditions. C: comparison of SU and MU DDI values for the translation conditions. Closed (open) circles: neurons with (without) significant MU tuning (ANOVA, P < 0.05). D: comparison of SU and MU DDIs for the rotation conditions.

