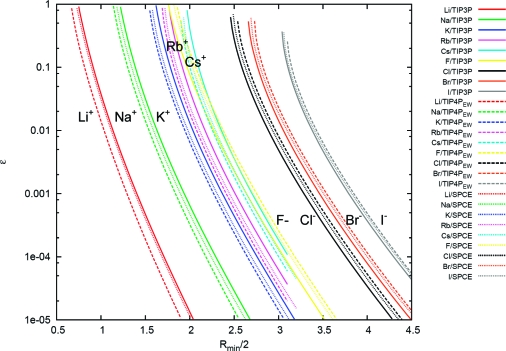
Figure 4.
Correlations between Rmin and ε for a given free energy of hydration by using the Marcus values. Shown are the correlations in Rmin and ε from the ΔGhydration = f(Rmin, ε) hypersurface at a given value of the hydration free energies. The chosen values are those from Marcus (see Table 10).(116) Points on the same line have equivalent hydration free energies, and each ion is denoted by a different color. The solid lines are for TIP3P water, the dashed lines are for TIP4PEW water, and the dotted lines are for SPC/E water. The units for the x and y axes are Angstroms and kcal/mol, respectively.

