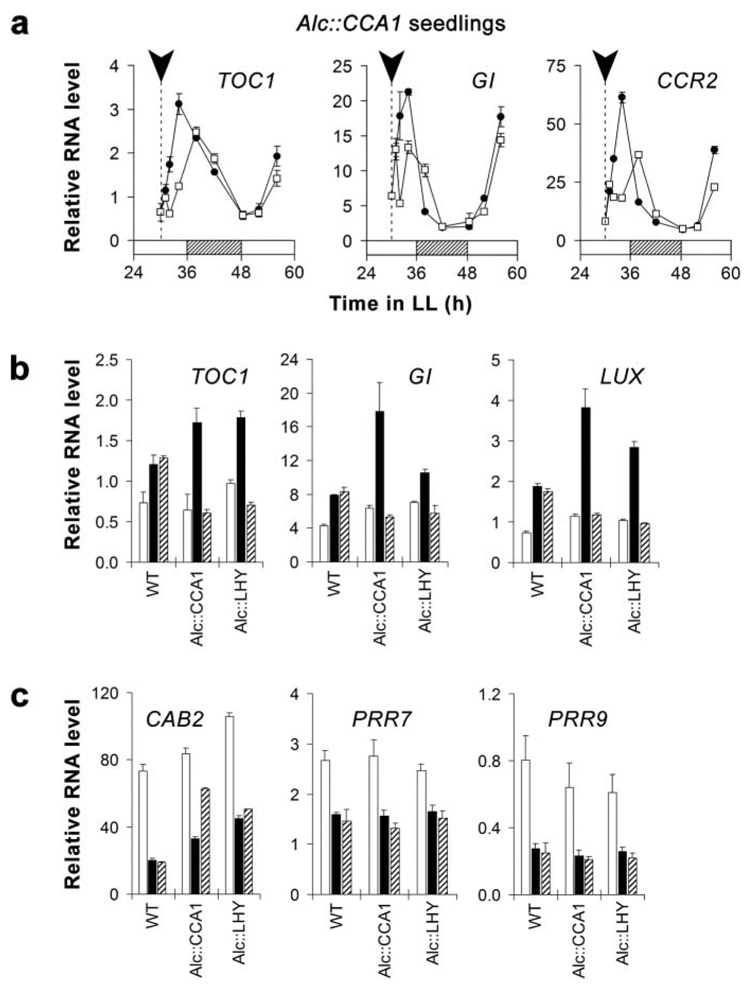
Figure 3. Effect of induced CCA1 or LHY expression in the middle of the subjective day (CT 6) on the expression of clock-controlled genes.
(a) A pulse of CCA1 expression delays the peak of TOC1, GI, and CCR2 RNA. Alc∷CCA1 seedlings were given an ethanol (EtOH) pulse at the time indicated by the arrowhead. Closed circles = untreated plants; open squares = EtOH-treated. (b) A pulse of CCA1 or LHY represses the accumulation of TOC1, GI, and LUX RNA. (c) Effect of CCA1 and LHY inductions on the accumulation of CAB2, PRR7, and PRR9 RNA. WT, Alc∷CCA1, and Alc∷LHY seedlings were given an EtOH pulse at 30 h in LL (CT 6). White bar = relative RNA level at the time of induction; black bar = level after 2 h (no EtOH); hatched bar = level 2 h after EtOH. RNA abundance was measured by quantitative RT-PCR and normalized to RNA HELICASE 8 (RH8). Error bars denote ± SD (n = 3).

