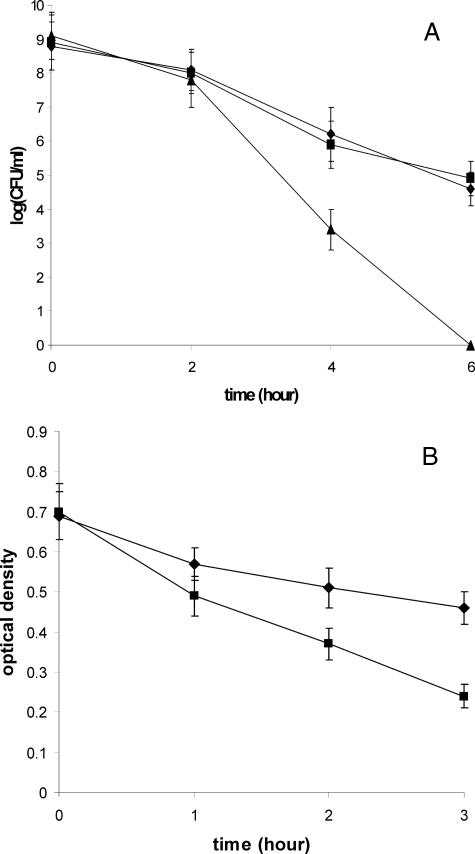
FIGURE 6.
Lysozyme sensitivity. A, cell survival curves of H. pylori strains (WT, diamond; hp310:kan mutant, triangle; the complemented strain, square) after treatment with 50 mg/ml lysozyme for the time indicated on x axis. B, absorbance at 600 nm of purified PG from H. pylori WT strain (diamond) or hp310:kan mutant (square) after treatment with 0.3 mg/ml lysozyme for the time indicated on x axis. The data are the means of three experiments with standard deviation as indicated.

