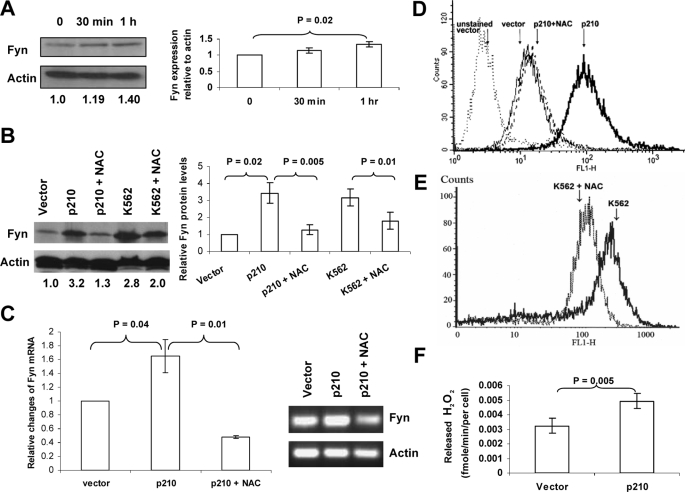
FIGURE 1.
The up-regulation of Fyn protein and mRNA in BCR-ABL1-expressing cells occurs in a ROS-dependent manner. A, hydrogen peroxide causes up-regulation of Fyn. K562 cells were treated with 1 mm H2O2 for 30 min or 1 h. Fyn protein levels were assessed by Western blot, and actin was used as a loading control. Trypan blue staining indicated that this short pulse of H2O2 was not cytotoxic. Densitometry, depicted in the bar graph, showing the ratio of Fyn to actin was normalized to control and was compiled from three independent experiments. B, NAC blocks up-regulation of Fyn in CML cells. K562 cells and BaF3 cells transduced with p210 BCR-ABL1 were treated with 24 mm NAC for 24 h. Fyn protein levels were assessed by Western blotting. The blot was then reprobed using an anti-actin antibody to ensure equal loading. The values below each lane represent the ratio of Fyn:actin protein expression. These values were calculated using densitometry, and each value was normalized to the non-BCR-ABL1 expressing BaF3 vector. The bar graph depicts densitometric values from three independent experiments. C, NAC decreases Fyn mRNA in BaF3 cells expressing BCR-ABL1. Fyn mRNA was measured in BaF3 p210 cells treated with diluent or 24 mm NAC for 24 h using RT-qPCR (p < 0.04). Relative change in expression was measured by calculating Ct values. The inset shows PCR products from that reaction resolved electrophoretically on an agarose gel. D and E, NAC lowers intracellular peroxide levels in BaF3 p210 and K562 cells. Cells were treated with diluent (solid line) or 24 mm NAC (dashed line) for 24 h followed by staining with dihydrodichlorofluorescein diacetate and analysis on the FL-1 channel of a flow cytometer to detect levels of intracellular peroxides. F, BCR-ABL1 p210-expressing cells release higher amounts of hydrogen peroxide than vector-expressing cells. BaF3 cells transduced with vector or BCR-ABL1 p210 were added to reaction buffer containing Amplex Red reagent and horseradish peroxidase, the absorbance at 560 nm was measured. Values depicted graphically were generated using a standard curve of absorbance using fixed increasing doses of hydrogen peroxide as described under “Experimental Procedures.”

