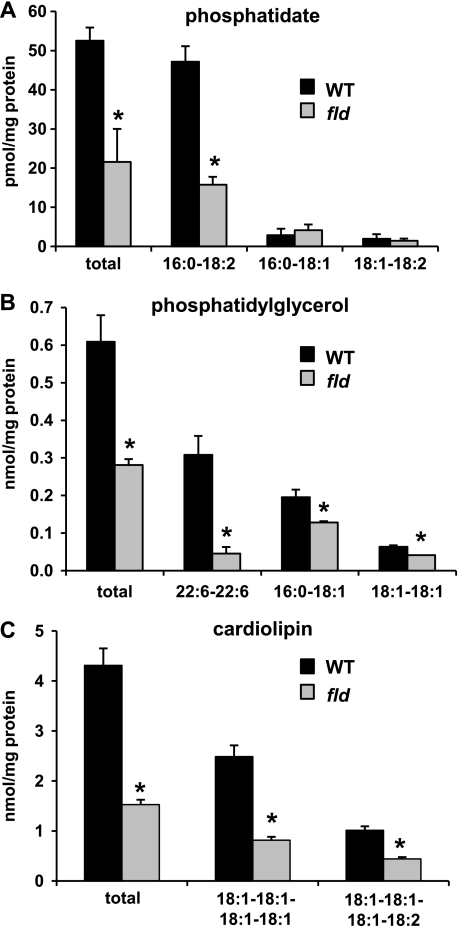
FIGURE 2.
Diminished hepatic content of phosphatidate and its derivatives in fld liver. The graphs depict mean levels of phosphatidic acid (A), phosphatidylglycerol (B), and cardiolipin (C) in liver of P8 WT and fld littermate mice (n = 4) as quantified by ESI-MS. The x axis labels indicate the fatty acid chain length and degree of saturation of the fatty acid moieties of the glycerolipid. *, p < 0.01 versus littermate WT mice.

