FIGURE 4.
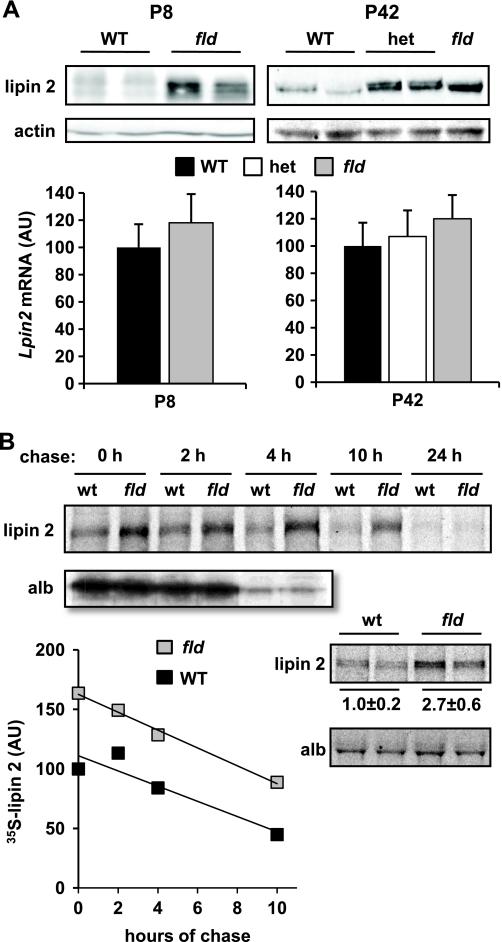
Rates of lipin 2 synthesis are induced in liver of fld mice. A, representative Western blots showing expression of lipin 2 and actin protein in hepatic lysates of WT, heterozygous, and fld mice at P8 and P42 are shown. The graphs below represent mean expression of Lpin2 mRNA in same mice. AU, arbitrary units. B, autoradiographs are representative of pulse-chase studies conducted with hepatocytes from WT or fld mice. Metabolic labeling and immunoprecipitation were performed as described under “Experimental Procedures.” The top image depicts radiolabeled lipin 2 or albumin at various times after chasing with unlabeled methionine. The intensity of the bands was quantified, normalized to protein, and the average of three experiments is plotted in the graph at the bottom. The lower autoradiograph depicts radiolabeled lipin 2 or albumin after a 30-min pulse with [35S]methionine. Quantification of the lipin 2 band intensity (normalized arbitrary units ± S.E.) is inset just under the autoradiograph.

