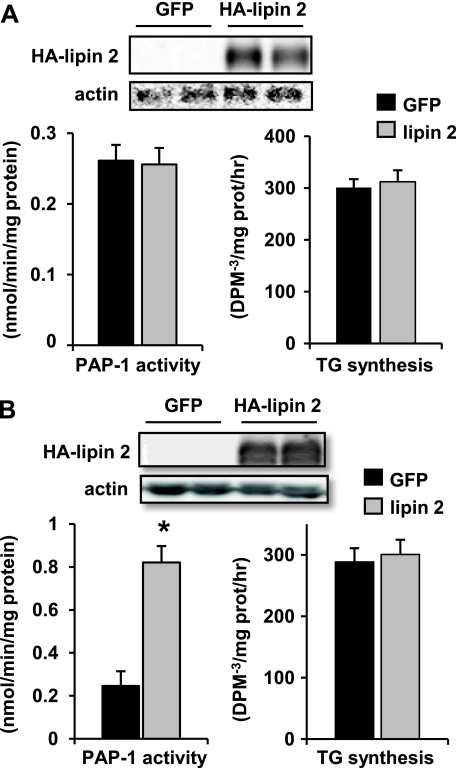
FIGURE 6.
Lipin 2 overexpression increases PAP-1 activity in HepG2 cells. The graphs depict mean PAP-1 activity (left) or rates of TG synthesis (right) in primary hepatocytes (A) and HepG2 cells (B) infected with adenovirus overexpressing HA-lipin 2 and/or green fluorescent protein (GFP). Rates of TG synthesis were determined in the presence of 0.3 mm bovine serum albumin-conjugated oleate. Representative Western blots using antibodies against HA epitope tag of lipin 2 or actin and lysates used for PAP-1 assays are inset at the top. *, p < 0.05 versus green fluorescent protein control.

