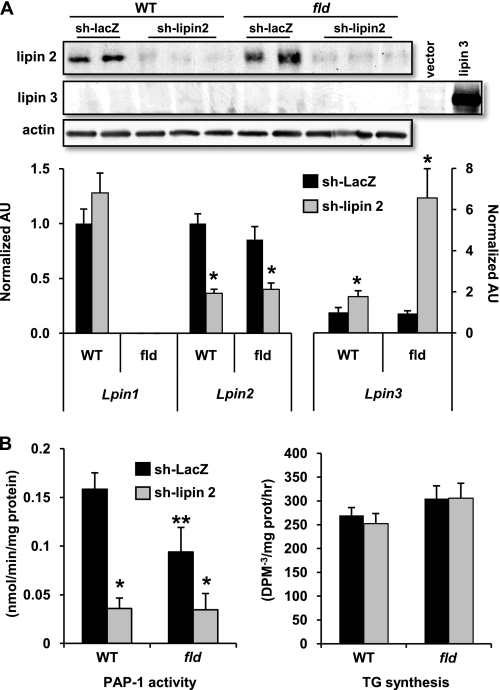
FIGURE 7.
Loss of lipin 2 markedly impairs hepatocyte PAP-1 activity but does not affect basal rates of TG synthesis. A, the autoradiographs inset at top depict representative Western blots showing expression of lipin 2, lipin 3, or actin protein in hepatocytes from WT or fld mice infected with adenovirus driving expression of shRNA targeting lipin 2 or LacZ (control). As a positive control for the lipin 3 Western blot, HepG2 cells were transfected with expression vector for lipin 3 or empty vector control. The graphs below depict mean expression of lipin 1, 2, or 3 mRNA in same cells. *, p < 0.05 versus LacZ control. AU, arbitrary units. B, graphs depict mean PAP-1 activity (left) or rates of TG synthesis (right) in hepatocytes from WT or fld mice infected with lipin 2 shRNA or control shRNA (against LacZ). p < 0.05 versus LacZ control (*) and p < 0.05 versus WT infected with LacZ shRNA (**).

