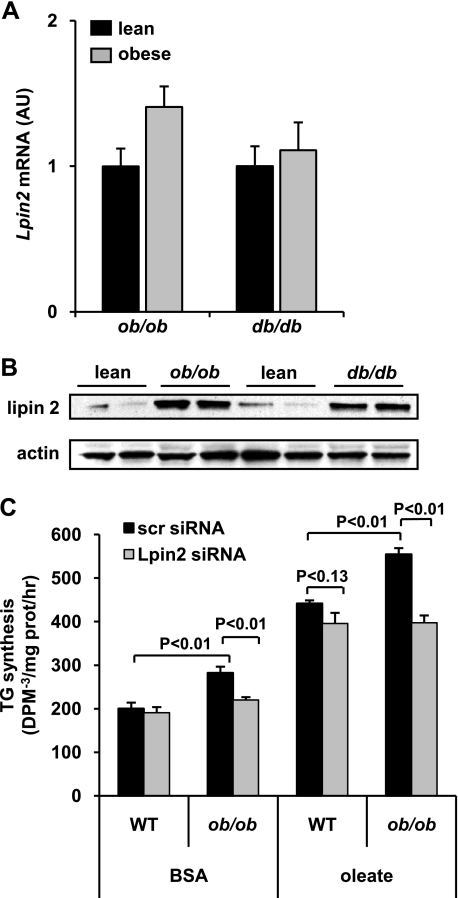
FIGURE 9.
Lipin 2 is induced by obesity-related diabetes. A, the graph depicts mean expression of Lpin2 in liver of ob/ob, db/db, or matched littermate lean control mice. B, representative Western blots showing expression of lipin 2 and actin protein in the same mice. C, the graph depicts mean rates of TG synthesis under basal (bovine serum albumin (BSA) with no additional fatty acids) or oleate-stimulated (0.5 mm for 30 min) conditions using hepatocytes isolated from WT or ob/ob mice.

