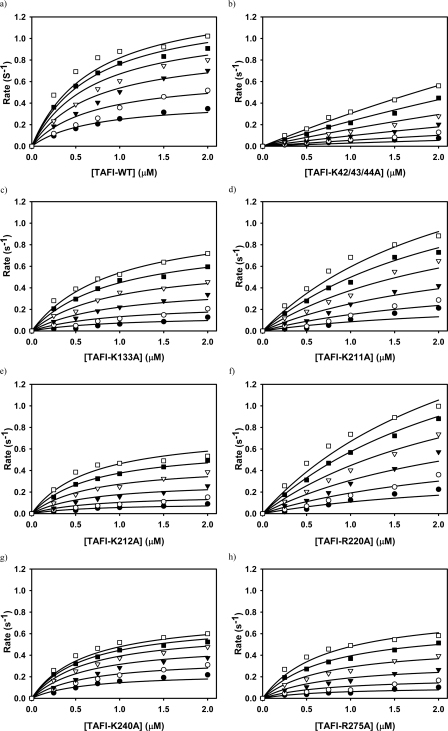
FIGURE 3.
Kinetics of activation of TAFI variants by the IIa-TM complex. The zymogens TAFI-WT (a), TAFI-K42/43/44A (b), TAFI-K133A (c), TAFI-K211A (d), TAFI-K212A (e), TAFI-R220A (f), TAFI-K240A (g), and TAFI-R275A (h), each at various concentrations, were incubated with IIa (0.5 nm) and TM at concentrations of 1.56 nm (•), 3.13 nm (○), 6.25 nm (▾), 12.5 nm (▿), 25 nm (▪), and 50 nm (□). TAFIa formation rates (mol of TAFIa formed/mol of thrombin/second) were calculated, and the complete data set was fit globally to Equation 7 as described previously (32). The lines are best-fit regression lines.

