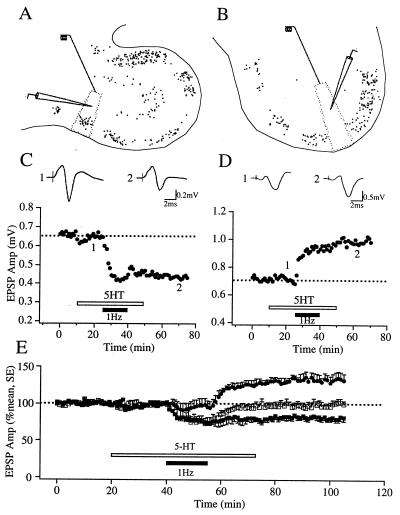
Figure 2.
Serotonergic facilitation of LTD and LTP in relation to CTX-gold-positive patches (which mark CO-rich and 5-HT2C receptor-poor zones). (A and B) Charts of tissue sections show patches of CTX-gold-labeled cells and the locations of the recording and stimulating electrodes as identified from lesions made after recording sessions. (C) LTD occurred in a column marked by a CTX-gold-positive patch. The time course of amplitude changes of population excitatory postsynaptic potentials (EPSPs) recorded from the same slice shown in A. Filled circles show the averaged responses before, during, and after LFS (1 Hz, 900 pulses) applied conjointly with 5-HT (1 μM). There was a persistent depression of the tested pathway if 1-Hz conditioning was applied in the presence of 5-HT. (D) LTP was evoked in a region falling between patches of CTX-gold-positive neurons. The time course of amplitude changes of population EPSPs recorded from the same slice shown in B. There was a persistent facilitation of the tested pathway if 1-Hz conditioning was applied in the presence of 5-HT. (C and D Insets) Field potentials averaged from 10 consecutive responses taken as indicated on the graphs. (E) Summary data (means ± SEM) show the time course of 5-HT-induced facilitation of LTD of the field EPSP amplitude within CTX-gold-positive patches (filled squares; n = 6) and LTP within a region falling between patches (filled circles; n = 5). There was no persistent change in the control group of slices (open squares; n = 10). The solid and open bars indicate the periods of LFS and 5-HT application, respectively.

