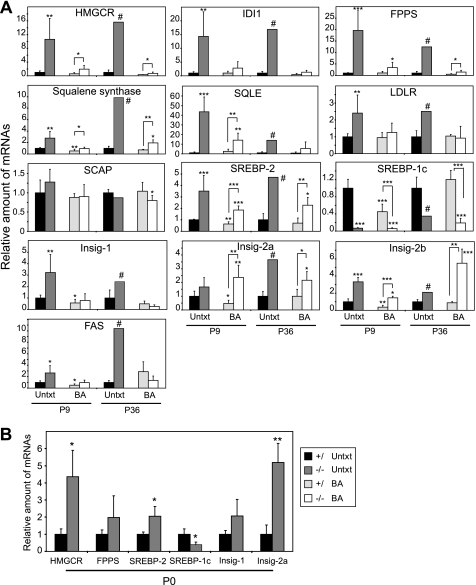
FIGURE 4.
Quantitative RT-PCR analysis of various mRNAs in livers from untreated and BA-fed control and PEX2-/- mice. The values obtained were normalized to 18S rRNA values. Each value represents the amount of mRNA relative to that in untreated controls at that age, which was arbitrarily defined as 1. A, P9 and P36 liver. Values are mean ± S.D. from RNA samples of at least five individual mice, except for P36 untreated PEX2-/-, where n = 1. B, P0 liver. Values are mean ± S.D. from RNA samples of four individual mice. *, p < 0.05; **, p < 0.01; ***, p < 0.001 versus untreated control mice or versus BA-fed control mice (indicated by brackets; Student's t test); #, outside 95% confidence interval of P36 untreated control mice. FPPS, farnesyl pyrophosphate synthase; SQLE, squalene epoxidase; LDLR, LDL receptor; FAS, fatty acid synthase.

