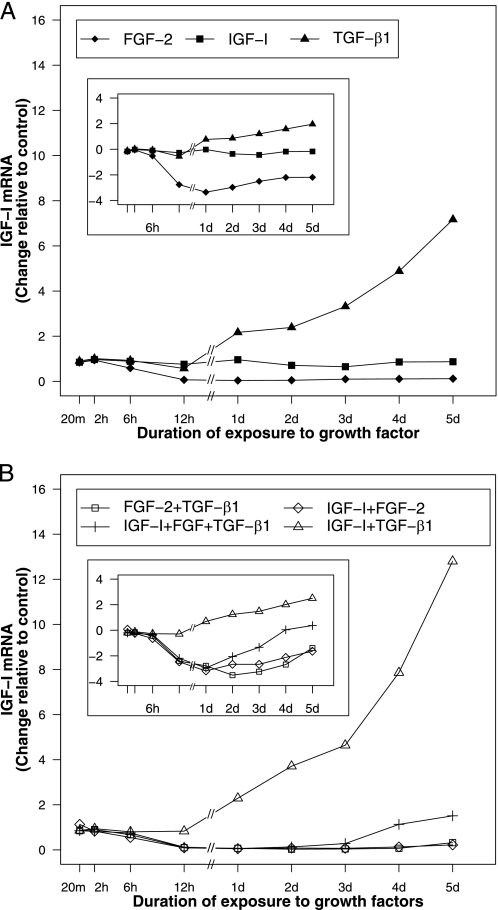
FIGURE 2.
IGF-I gene expression in articular chondrocytes treated with FGF-2, IGF-I, and TGF-β1 individually (A) and in combination (B). Articular chondrocytes were incubated with 50 ng/ml FGF-2, 200 ng/ml IGF-I, or/and 100 ng/ml TGF-β1, or no growth factor (control) and harvested after the indicated time periods. Data are expressed as fold change compared with control. The same data are expressed as the natural logarithm of fold change of IGF-I mRNA (inset).

