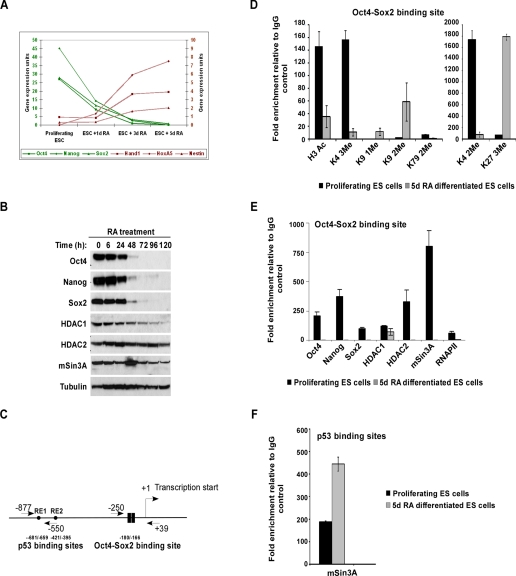
FIGURE 1.
Recruitment of the mSin3A-HDAC complex to the Nanog promoter during ES cell proliferation. A, qPCR analysis of ES cells in the presence of 5 μm retinoic acid (RA) showing a decrease in pluripotency markers Oct4, Nanog, and Sox2 and an increase in lineage markers Hand1, HoxA5, and Nestin. B, Western blot showing levels of Oct4, Nanog, Sox2, HDAC1, HDAC2, and mSin3A upon RA treatment (5 μm). Tubulin was used as a loading control. C, schematic of the proximal Nanog promoter showing positions of Oct4-Sox2 and p53 binding sites relative to the transcription start site. Arrows denote location of primers used for chromatin immunoprecipitation (ChIP) relative to the transcription start site.D and E, ChIP assays were performed for histone modifications, transcription factors, and deacetylase complex members as indicated using protein extracts of proliferating and 5-day RA-treated ES cells, with primers amplifying the Oct4-Sox2 binding site of the Nanog promoter. Values are expressed as -fold enrichment relative to IgG control ChIP. Results shown are the average of three independent PCR reactions. F, ChIP from proliferating and 5-day RA-treated ES cells using antibodies to mSin3A with primers amplifying the p53 binding site of the Nanog promoter.

