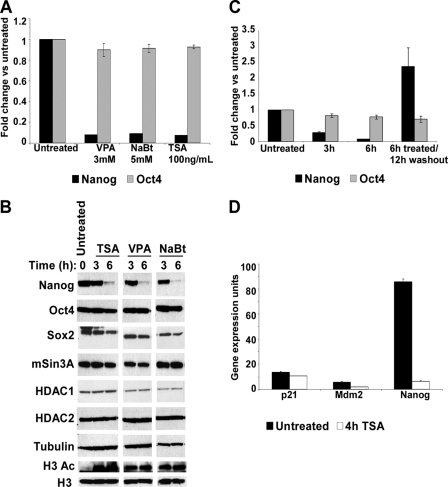
FIGURE 3.
HDAC inhibitors reduce Nanog gene expression. A, qPCR analysis of Nanog and Oct4 gene expression in the presence of valproic acid (VPA), sodium butyrate (NaBt), and trichostatin A (TSA) for 6 h expressed as -fold change over those untreated. B, Western blot showing levels of Nanog, Oct4, Sox2, mSin3A, HDAC1, and HDAC2 protein levels in the presence of TSA, valproic acid, and sodium butyrate for the times indicated. Total acetylated histone H3 levels were analyzed using H3Ac-specific antibodies as a positive control for HDAC inhibitor treatment. Tubulin and total histone H3 were used as loading controls. C, qPCR analysis of Nanog and Oct4 mRNA in the presence of 100 ng/ml TSA expressed as -fold change over those untreated. Duration of treatment and washout is indicated at the bottom. D, qPCR analysis of Nanog, p21, and Mdm2 mRNA in the presence of 100 ng/ml TSA for 4 h expressed as gene expression units relative to glyceraldehyde-3-phosphate dehydrogenase.

