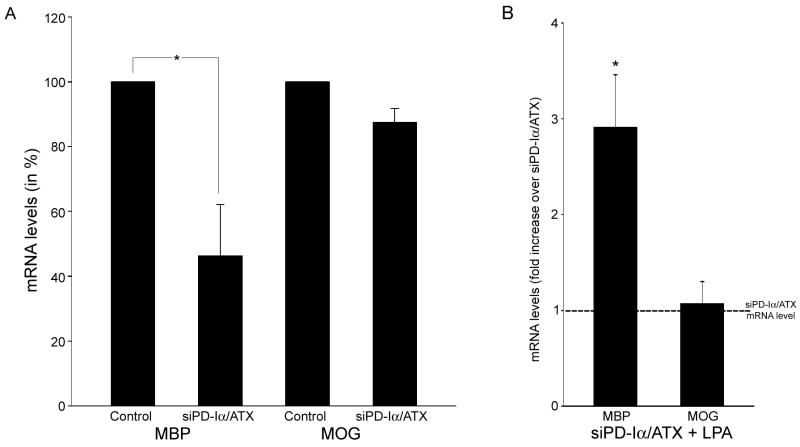
Fig. 5.
LPA-induced increase in the number of MBP-positive cells is due to an increase in MBP mRNA levels. Differentiating oligodendrocytes were isolated and treated as described in Fig. 2. mRNA levels for MBP and MOG were determined by real-time qRT-PCR [41]. 18S rRNA was used for normalization. A. Bar graph depicting mRNA levels as % of control (control levels were set to 100%). B. Bar graph illustrating the fold increase in mRNA levels upon LPA treatment (mRNA levels under siPD-Iα/ATX conditions were set to 1; see dotted line). For both graphs, means ± SEM of three independent experiments done in duplicates are shown. Stars indicate an overall two-tailed significance level of p<0.05 as determined by Student’s t-test analysis.

