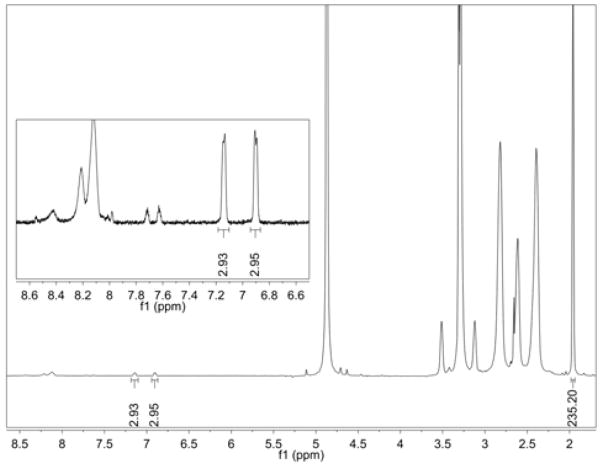
Figure 2.
1H NMR spectrum for Sample D. The average number of ligands per dendrimer was determined by comparison of the aromatic protons on the ligand vs. the methyl protons in the acetyl group of the dendrimer. The number of acetyl groups was determined independently by GPC and potentiometric titration.

