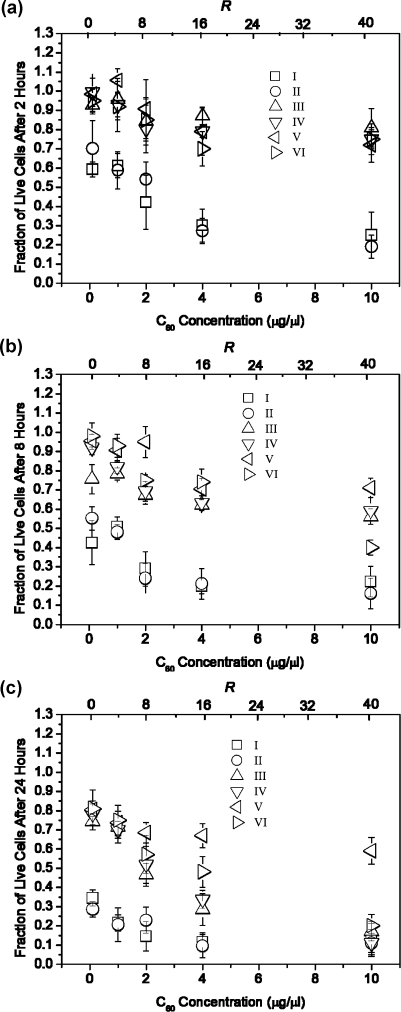
Figure 3.
Fraction of live NIH 3T3 cells after incubation with the different C60/DNA transfection mixtures as a function of C60 compound concentration and varying R value after (a) 2 h, (b) 8 h, or (c) 24 h post-transfection incubation time, under serum-free conditions respectively. Error bars represent the mean ± standard deviation for n = 4.

