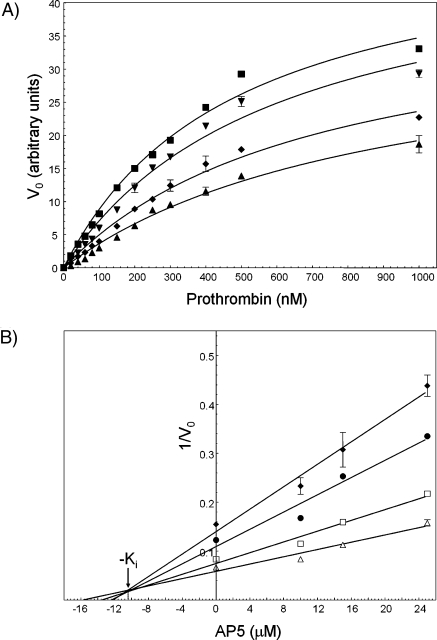
Figure 4.
Kinetic analyses of prothrombin activation by prothrombinase in the presence of AP5. (A) Michaelis−Menten plots. Prothrombin generation experiments were performed in the absence (◼) and presence of increasing concentrations of AP5 [10 (▼), 15 (◆), and 20 µM (▲)], as described in using prothrombin concentrations varying from 40 nM to 1 µM. Initial rates of thrombin formation are plotted as a function of substrate concentration. (B) Analysis of the data using the Dixon plots. The data were analyzed and plotted as 1/Vo as a function of inhibitor concentration (AP5, Dixon plots). For mixed-type inhibition, a Dixon plot of 1/Vo as a function of increasing concentration of inhibitor is linear at a fixed enzyme and substrate concentration (53). The apparent inhibition constant (Ki) reported in the text is the value derived from the intercept of each of the four graphs (∼10.5 µM). The lines drawn represent the best fit through the points with an R2 varying from 0.9812 (worst) to 0.9881 (best). The following concentrations of prothrombin were used in the experiments: 80 (◆), 100 (●), 150 (◻), and 200 nM (△).

