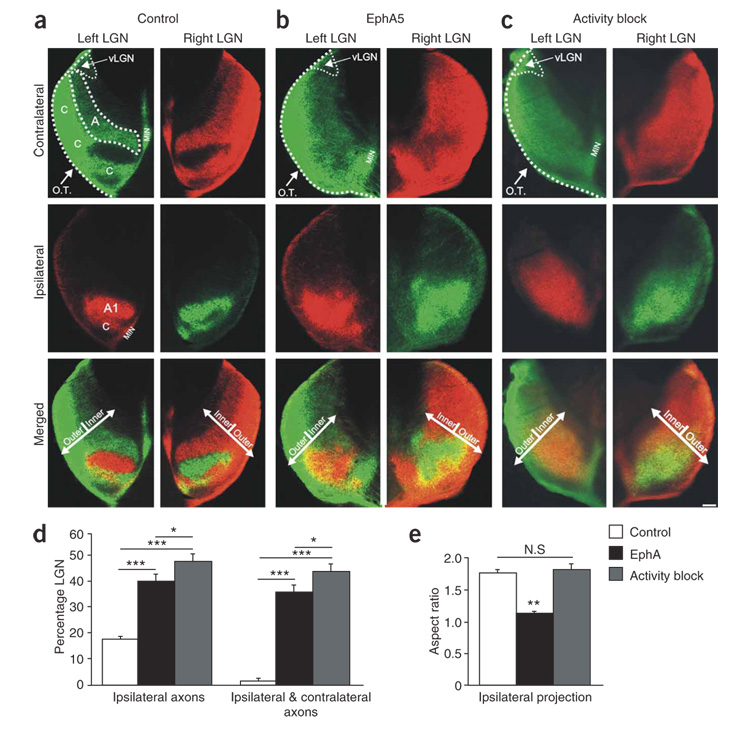
Figure 4. Effect of EphA overexpression on eye-specific targeting and comparison to activity blockade.
(a–c) Contralateral eye inputs (top), ipsilateral eye inputs (middle) and their merged representation (bottom) in the left and right LGNs of (a) a P10 control ferret, (b) a P10 ferret that was binocularly electroporated with EphA5 on P1 and (c) a P10 ferret that had all retinal activity blocked from P1 to P10. Horizontal sections are shown. O.T., optic tract; MIN, medial intralaminar nucleus; vLGN, ventral lateral geniculate nucleus; A, contralateral layer; A1, ipsilateral layer; C, nonprincipal C layers; the boundaries of A and A1 and the optic tract are shown with dashed lines for the left LGN. The outer-inner axis (perpendicular to eye-specific layers) is shown by arrows (merged panels). Scale bar, 100 µm. (d) Quantification of the extent of the ipsilateral eye projection area and the degree of binocular intermingling in the LGN. Both EphA overexpression and activity blockade caused significant increases in the area of the LGN containing ipsilateral eye input and the intermingling of ipsi- and contralateral axons, compared to controls (*** P < 0.005). The effect of activity blockade was significantly greater than the effect of EphA overexpression on both these measures (* P < 0.05, unpaired t-test; n = 22 control cases; n = 15 binocular EphA5; n = 12 activity blocked). (e) Quantification of aspect ratio (long axis:short axis) for ipsilateral eye input to LGN in control (n = 12), EphA-transfected (n = 15) and retinal activity–blocked (n = 11) ferrets. (P > 0.05, not significant (N.S.); ** P < 0.01; t-test).

