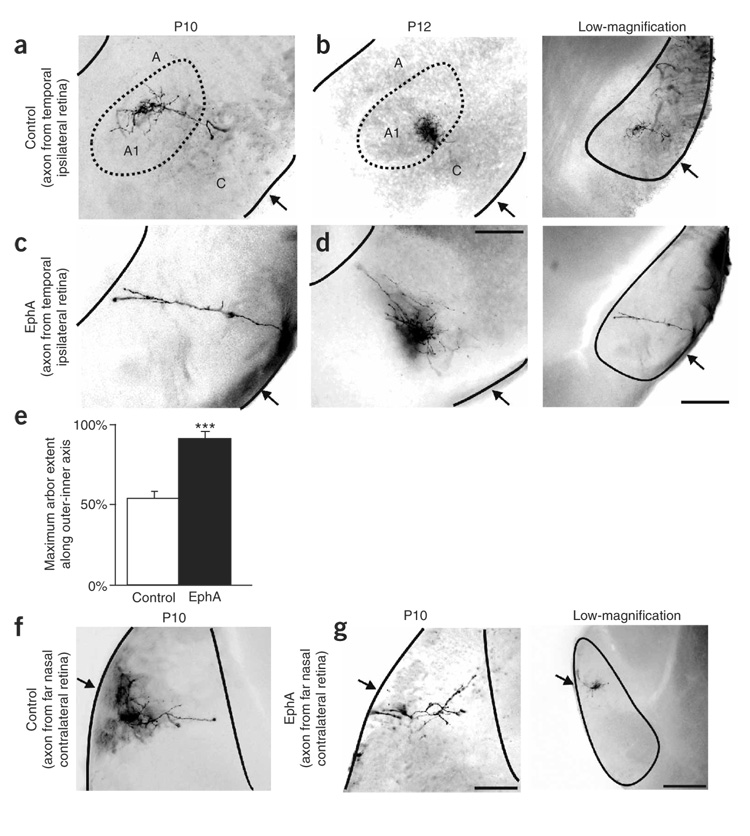
Figure 6. Effects of EphA overexpression on targeting of individual retinogeniculate axons.
(a,b) RGC axons labeled from the far temporal retina of (a) a control P10 ferret and (b) a control P12 ferret, seen in the ipsilateral LGN. Low-magnification photomicrographs show the location within the LGN where axons were imaged (corresponds to same case as in a). Arrows indicate the optic tract. (c,d) RGC axons labeled from the far temporal retina of (c) a P10 EphA5-transfected (binocular electroporation) ferret and (d) a P12 EphA5-transfected (binocular electroporation) ferret, in the ipsilateral LGN. Low-magnification image corresponds to c. (e) Quantification of the maximum extent of the outer-inner axis in which axons from the ipsilateral retina are found. Axons from EphA animals projected significantly farther inward than did those from controls (n = 7 control; n = 7 binocular EphA5; *** P < 0.005, paired t-test). (f) RGC axon originating from the far-nasal retina of a control-transfected ferret, seen within the anterior portion of the contralateral LGN. (g) RGC axon labeled from the far nasal retina of an EphA5-electroporated ferret (binocular) seen in the anterior portion of the contralateral LGN. Low-magnification image shows nasal axon in the anterior LGN from an additional control. (a–g) Scale bar, 200 µm. In low-magnification images, scale bar = 400 µm. Horizontal plane is shown.

