
Table 2. Differentiation between paired samples of tsetse flies from Guinea as measured by F
ST (Weir and Cockerham estimator) and 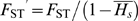 , corrected for polymorphism with Nei's genetic diversity averaged over the two compared samples.
| Sub-samples | F ST | P-value |

|
F ST′ | |
| Geographical | Falessadé and Dubréka 2005 | 0.0188 | 0.0001 | 0.6991 | 0.0625 |
| Falessadé and Fotoba 2005 | 0.0715 | 0.0001 | 0.6086 | 0.1827 | |
| Dubréka and Fotoba 2005 | 0.0971 | 0.0001 | 0.6055 | 0.2461 | |
| Fotoba and Kassa North 2006 | 0.0989 | 0.0014 | 0.4963 | 0.1963 | |
| Fotoba and Kassa South 2006 | 0.1380 | 0.0158 | 0.4200 | 0.2379 | |
| Kassa North and South (2006, 2007) | 0.0854 | 0.0119 | 0.5620 | 0.1949 | |
| Temporal | Fotoba 2005 and 2006 | 0.0240 | 0.0441 | 0.4900 | 0.0471 |
| Kassa North 2006 and 2007 | 0.0242 | 0.1655 | 0.5612 | 0.2272 | |
| Kassa South 2006 and 2007 | 0.1683 | 0.0271 | 0.4548 | 0.3087 |
Both geographical (contemporaneous sub-samples) and temporal (sympatric sub-samples) are provided and P-values are also given (all significant except between Kassa North 2006 and 2007). For Kassa North and South (2006, 2007) F ST was averaged over years and the corresponding P-value obtained with Fisher's procedure.