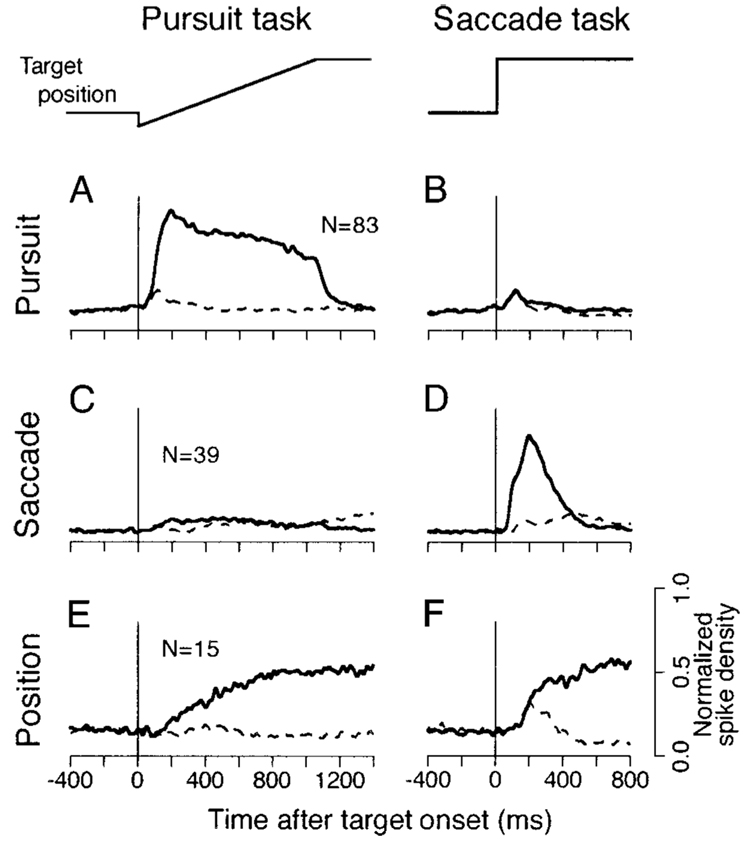
FIG. 1. Qualitative definition of different neuronal types according to the time courses of population activity during different eye movement tasks.
Each pair of side-by-side traces plots mean of the normalized spike density of a single neuron type. The 2 columns show responses during the pursuit and saccade tasks. The traces labeled “target position” summarize the target motion for the 2 tasks. The solid traces indicate responses during eye movements in the cell’s preferred direction, while the dashed traces indicate responses for the opposite direction. A and B: activity of pursuit cells. C and D: saccade cells. E and F: eye position cells. In pursuit trials, the target jumped 3–4° and moved in the opposite direction for 1,000 ms at 20°/s. In saccade trials, the target jumped 16°.

