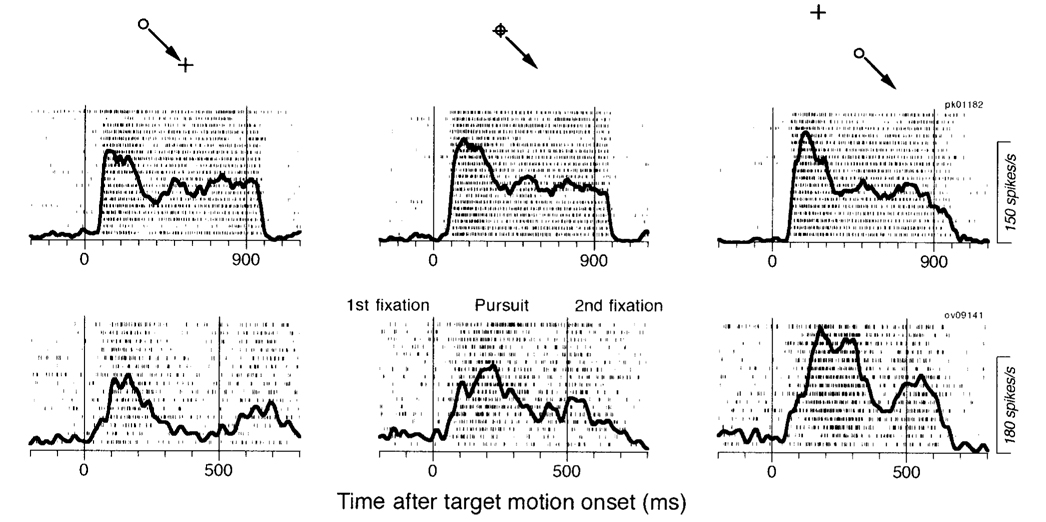
FIG. 11. Sensitivity of pursuit responses to orbital eye position in 2 FPA pursuit neurons.
The insets above each column indicate the target configuration, with the circle showing the location of the moving target, the arrow indicating the direction of target motion, and the plus sign showing the center of the screen. The 2 rows of rasters show data from 2 neurons. Each raster shows the responses to multiple repetitions of the target configuration indicated by the inset at the top of the column. The bold trace shows the average spike density. The 2 vertical lines indicate the onset and offset of target motion. The target was visible and stationary before and after the motion interval, and the animals were required to fixate the target during those periods. The responses of the cell in top row were tested for right and downward pursuit, whereas those in bottom row were tested for downward pursuit.

