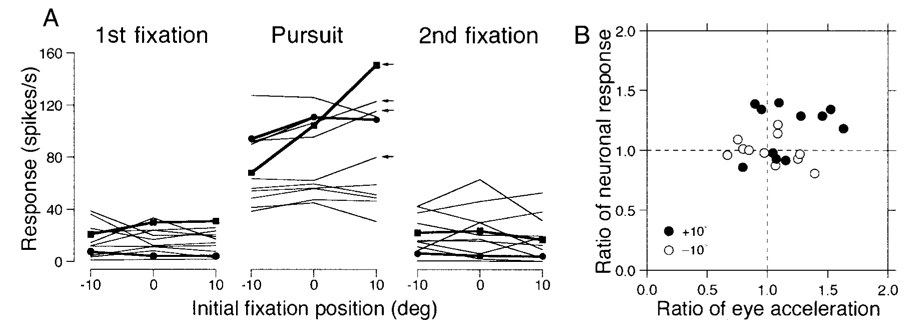
FIG. 12. Quantitative summary of the effect of orbital position on the responses of FPA pursuit neurons.
A: each set of connected points shows data from 1 neuron, and each symbol plots average firing rate as a function of the initial orbital position of the eye at the start of the same step-ramp target motion. From left to right, the 3 graphs show data for 3 measurement intervals: 300 ms before target motion onset (1st fixation); 400-ms interval starting 100 ms after target motion onset (Pursuit); and 300-ms interval starting from 300 ms after target motion offset (2nd fixation). Positive values on the abscissa indicate fixation orbital positions in the preferred pursuit direction of the neuron under study. Filled symbols and bold lines show the data for the example neurons used in Fig. 11. The 4 small arrows at the right of the pursuit graph indicate the 4 neurons with regression slopes > 1.0. B: each symbol summarizes the responses of 1 neuron and plots the neuronal activity as a function of eye acceleration during the initiation of pursuit. Filled and open symbols plot data for initial orbital positions at −10 or +10° relative to the center of the screen along the preferred axis of the neuron under study. Both the neuronal activity and eye acceleration for trials with eccentric starting locations (±10°) were normalized for the responses in pursuit trials that started with central fixation.

