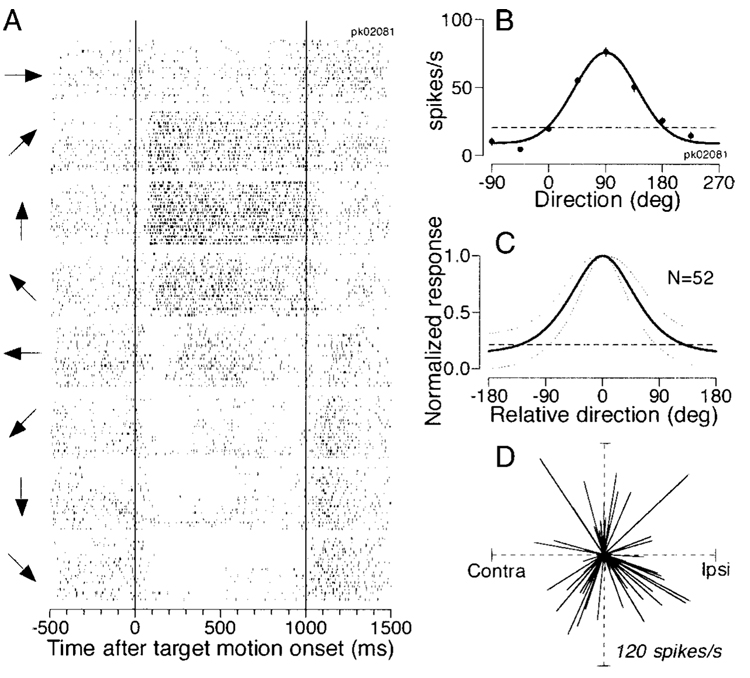
FIG. 2. Quantitative analysis of direction tuning of pursuit neurons in the frontal pursuit area (FPA).
A: raster display of a pursuit cell activity for 8 different pursuit directions. Two vertical lines indicate the onset and offset of target motion. The arrows at the left of each group of rasters indicate the directions of target motion. B: direction tuning for the cell shown in A. Each point plots the mean firing rate as a function of the direction of pursuit. The curve shows the result of fitting the points with a Gaussian function. Error bars show the SE, but are less that the diameters of the data points for most directions. The horizontal dashed line indicates baseline activity measured from 300 ms before target motion onset. C: the solid curve shows the normalized tuning averaged across 52 pursuit neurons. The dotted lines surrounding the tuning curve indicate 1 SD. D: each line represents a vector that starts at the center of the polar plot and shows the preferred direction and amplitude of modulation derived from the Gaussian function fitted to the direction tuning of each pursuit neuron.

