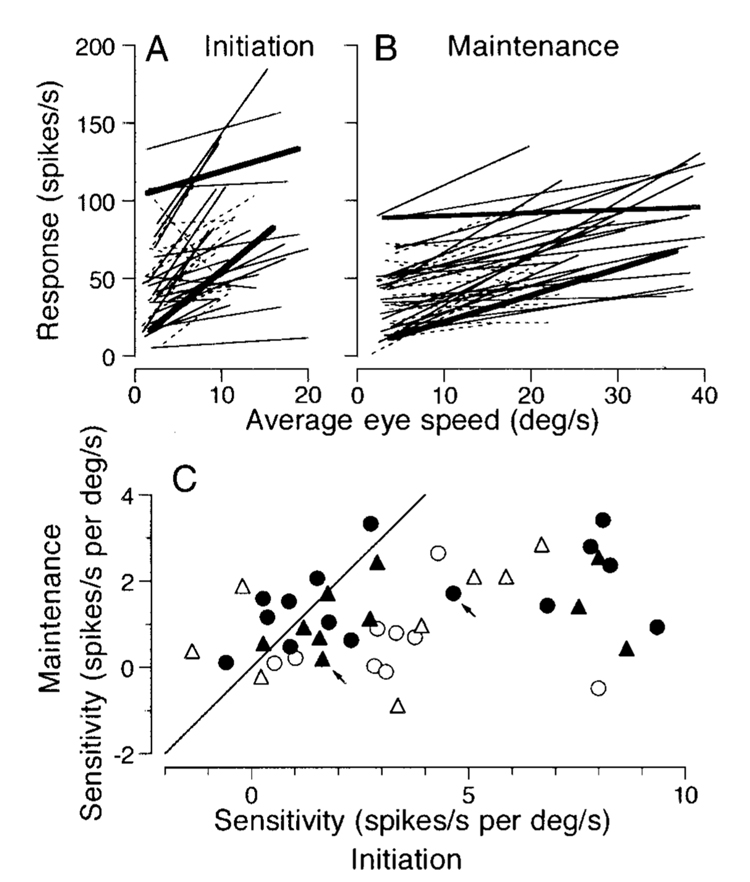
FIG. 5. Quantitative summary of the eye velocity sensitivity of FPA neurons.
A and B: regression lines summarizing the sensitivity of 43 FPA pursuit neurons to eye velocity at the initiation (A) and maintenance (B) of pursuit. Continuous lines summarize data for 25 neurons examined for 5 different target velocities, while dashed lines show data for 18 cells tested only for 3 target velocities. Bold lines correspond to the neurons that provided the data shown in Fig. 4. In A, data from 1 neuron were above the range of the plot and have been omitted. C: comparison of the eye velocity sensitivity measured during the maintenance of pursuit and at the initiation of pursuit. Each symbol plots data from a different neuron. Filled and open symbols indicate data from cells examined for 5 or 3 different target velocities, respectively. Triangles indicate data from the neurons that showed directional modulation of firing rate more than 15 ms before the initiation of pursuit. Arrows point to the symbols for the 2 neurons that provide the data shown in Fig. 4.

