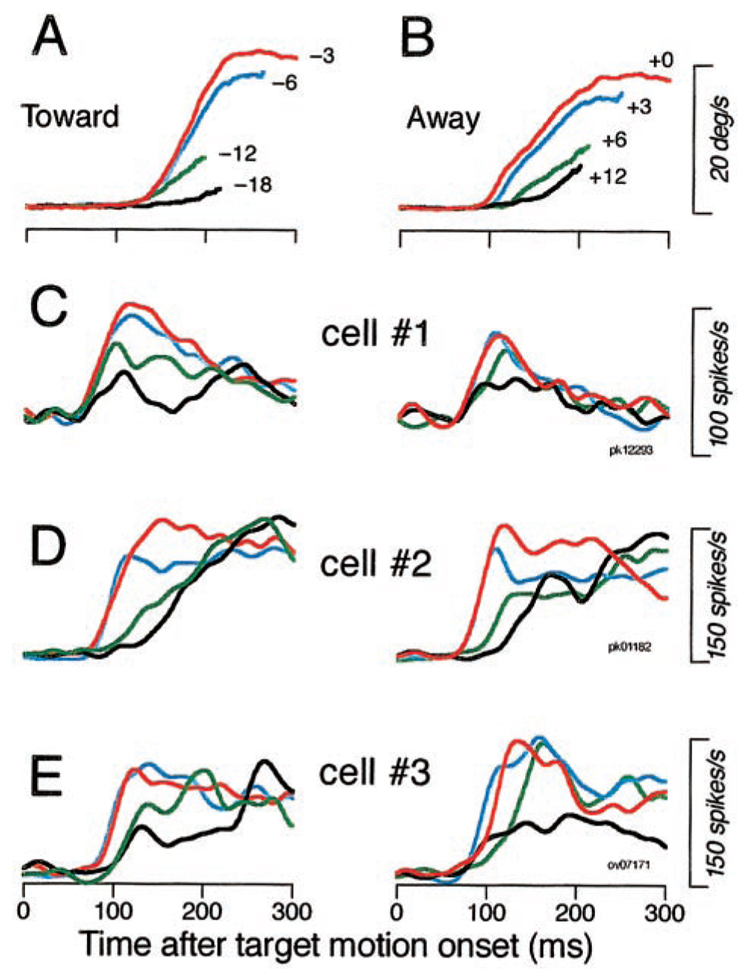
FIG. 6. Parallel effects of the initial position of the moving target on the initiation of pursuit and the responses of FPA pursuit neurons.
A and B: traces show the time course of eye velocity during recording from cell 1. Different colors indicate different initial target positions, given by the numbers at the end of the traces. Results for target motion toward (A) or away (B) from the position of initial fixation are shown separately. Motion was always in the preferred direction of the neuron under study at 20°/s. The traces have varying lengths because they were truncated at different times by the 1st tracking saccades. C–E: time course of spike density for 3 neurons. Different color traces indicate different initial target positions according to the values given in A and B.

