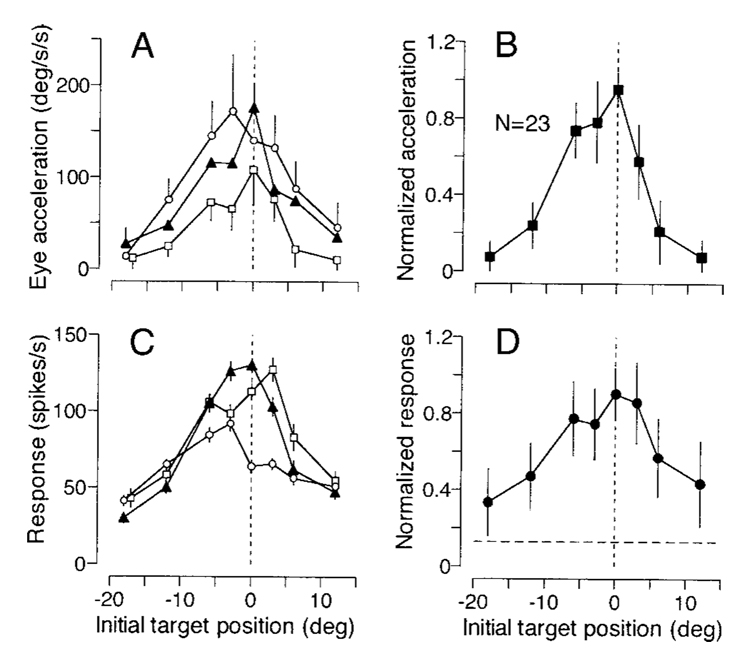
FIG. 7. Quantitative analysis of parallel effects of the initial position of the moving target on the initiation of pursuit and the responses of FPA pursuit neurons.
A: initial eye acceleration measured from 121–180 ms after target motion onset is plotted as a function of initial target position for the 3 different recording experiments from Fig. 6. Error bars are shown only for a subset of data points to avoid overlap. B: summary of 23 experiments, showing averages of normalized eye acceleration as a function of initial target position. C: firing rate in the interval 91–180 ms after target motion onset is plotted as a function of initial target position for the same 3 experiments shown in A. D: summary of 23 experiments, showing averages of normalized neuronal activity as a function of initial target position. The horizontal dashed line indicates mean baseline activity measured from the 300-ms interval before target motion onset. Error bars indicate either 1 SE of the measurements from individual neurons (A and C) or 1 SD of the means across the population (B and D). In all 4 graphs, negative and positive values of initial target position correspond to trials in which the ramp of target motion moved the target toward and away from the position of fixation, respectively.

