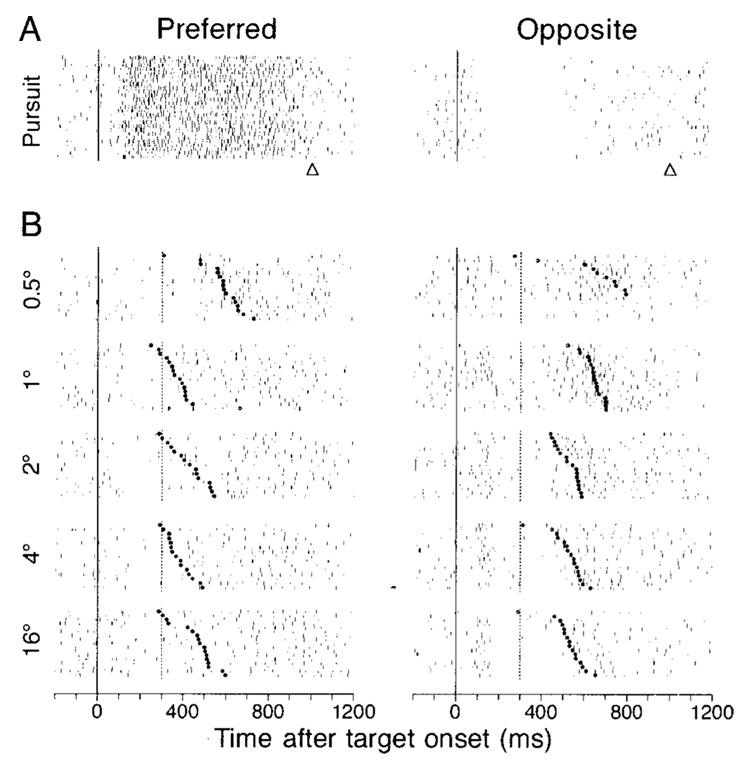
FIG. 8. Responses to steps of target position and saccades in a representative pursuit neuron.
Each group of rasters shows the responses to a multiple repetitions of a trial. The left and right columns show responses during pursuit (A) or saccades (B) in the preferred direction of the neuron under study and the opposite direction, respectively. Preferred direction for this neuron was downward. From top to bottom, the target motions were step-ramps with 4° steps and 20°/s ramps, and target steps of 0.5, 1, 2, 4, and 16°. The continuous vertical lines show the onset of target motion (A) or the time of the target step (B). In the pursuit trials (A), the triangles below rasters indicate the time of target motion offset. In the saccade trials (B), the vertical dashed lines show the time when the fixation target was extinguished in the overlap task, and the bold dots show the time of saccade initiation. Within each group, trials have been ordered according to saccade latency.

