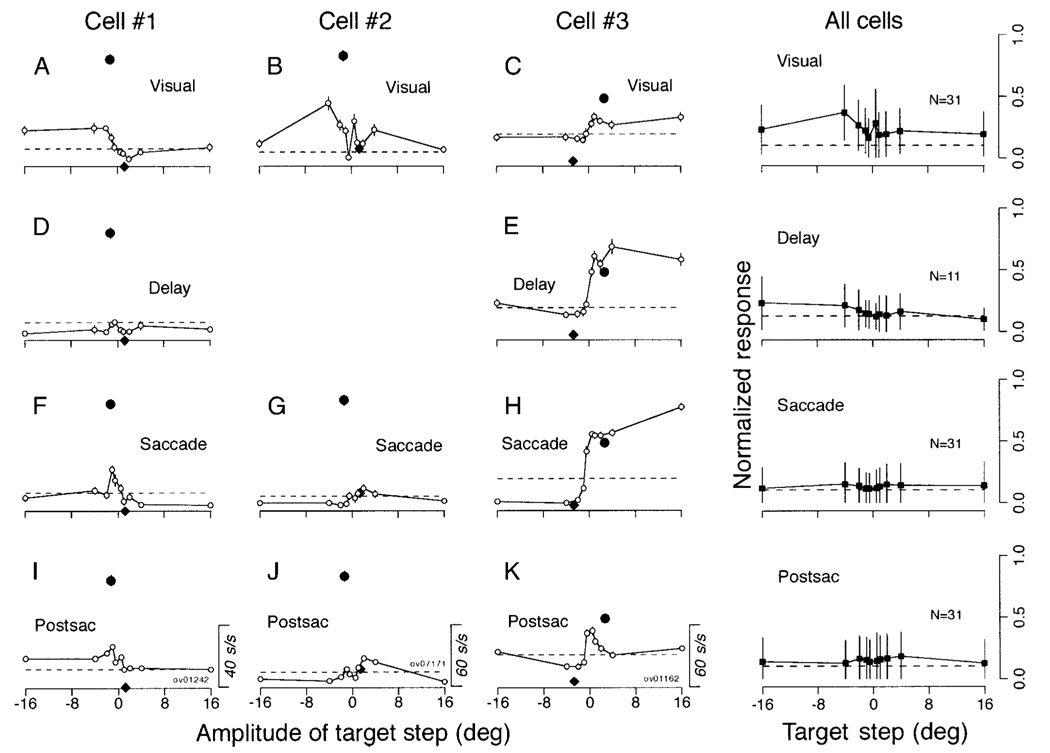
FIG. 9. Quantitative summary of responses of FPA pursuit neurons during steps of target position and saccades.
The left-hand 3 columns summarize responses of 3 pursuit neurons, and the right column shows averages across all pursuit neurons with responses like those in cells 1 and 2. Cell 1 in this figure depicts data from the cell shown in Fig. 8. A–K: the open symbols in each graph plot the mean and SE of neuronal response as a function of the amplitude of the target step, and different rows show data from different task intervals. Row 1: 80-ms period starting from 90 ms after target onset (Visual, A–C). Row 2: the period starting from 180 ms after target onset to 50 ms before saccade onset (Delay, D and E), Row 3: 80-ms period starting from 40 ms before saccade onset (Saccade, F–H). Row 4: 80-ms period after saccade offset (Postsac, I–K). The filled circle plots the maximal value of the mean firing rate during pursuit within any 80-ms interval as a function of retinal position of target image 80 ms before the measuring interval. The black diamond indicates response at the same task interval but during pursuit in the opposite direction. The measurement intervals of the neuronal activity for the cells 1–3 started 180, 122, and 376 ms after target motion onset, respectively. Horizontal dashed lines indicate baseline activity during the 300 ms before the step of target position. The column labeled “All cells” plots the mean and SD of the normalized responses to target steps across our sample of neurons. Positive values along the abscissa indicate the preferred direction for pursuit.

