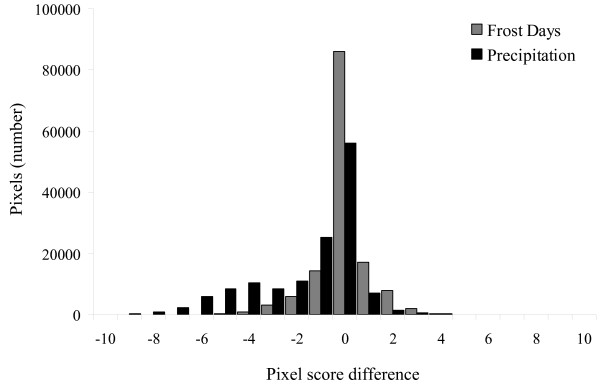
Figure 2.
Histogram showing the distribution of pixel score differences between the comprehensive map and two jackknife maps. Exemplar jackknife maps produced by exclusion of 'mean annual precipitation' and 'frost days' layers from the model were chosen to illustrate distributions resulting in significant versus non-significant findings, respectively. The sign of the mean difference (positive or negative integer value) indicates whether each jackknife layer map over-predicted (negative) or under-predicted (positive) the distribution as compared to the comprehensive map. A jackknife parameter having many pixels with values of or close to zero (difference = 0) presents a distribution most similar to the comprehensive map, indicating that its exclusion does not seriously affect the distribution of disease.

