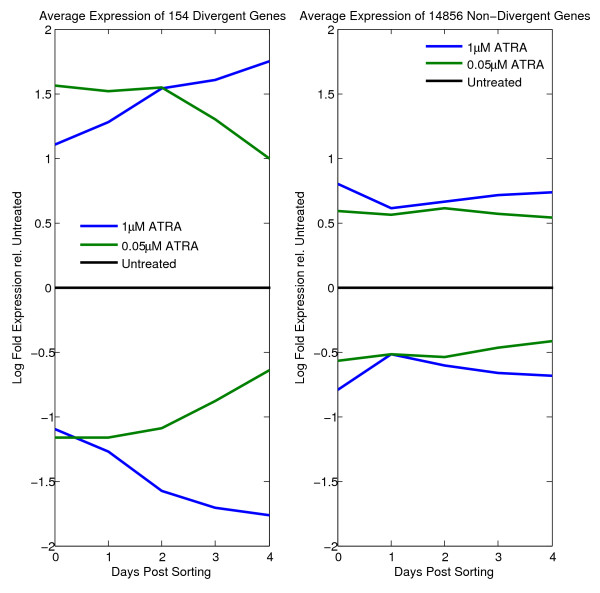
Figure 2.
Average mRNA gene expression of the differentially expressed genes. The left panel shows the divergent genes. The right panel shows the non-divergent genes. The upper parts of the figures represent the genes that are up-regulated in both 1 μM/5 Days and 0.05 μM/7 Days treatments relative to untreated controls. The lower parts represent the genes that are down-regulated in both 1 μM/5 Days and 0.05 μM/7 Days treatments relative to untreated controls.

