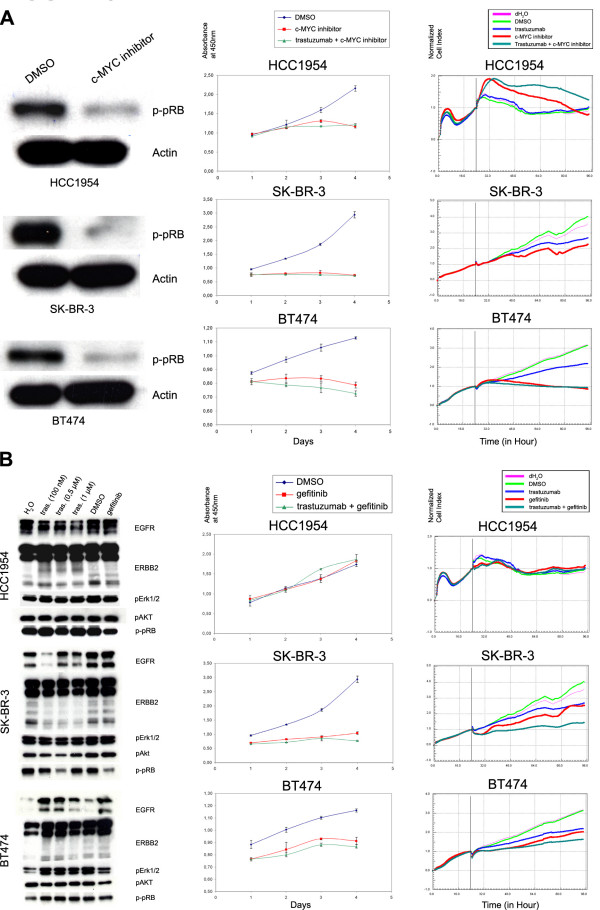
Figure 8.
Effects of c-MYC inhibitor 10058-F4 and EGFR inhibitor gefitinib alone or in combination with trastuzumab on the viability of resistant (HCC1954) and sensitive (SK-BR-3 and BT474) cells. A. Left panel: Western blot data showing the phosphorylation state of pRB protein after treatment with c-MYC inhibitor (10058-F4, 80 μM) for 24 hours. Middle panel: WST-1 viability assay over 4 days to determine the response of cells to c-MYC inhibitor alone and in combination with trastuzumab. DMSO is used as vehicle control. Right panel: Impedance measurement for real-time determination of cell growth before (24 hours) and after (72 hours) treatment of cells with c-MYC inhibitor, trastuzumab, and the combination of both drugs. The impedance measurements were normalized to the time point where we have added the drugs. The vertical line demonstrates the time point of normalization. B. Left panel: Western blot data showing the effect of different concentrations of trastuzumab and gefitinib (1 μM) on the expression levels of EGFR and ERBB2 and on the phosphorylation states of ERK1/2, AKT and pRB proteins. H2O is vehicle control for trastuzumab and DMSO is for gefitinib. Middle panel: WST-1 assay to determine the response of cells to gefitinib and gefitinib + trastuzumab. Right panel: The impedance measurement for real-time measurement of cell growth before (24 hours) and after (72 hours) treatment of cells with gefitinib, trastuzumab and combination of both drugs. Normalization of cell index is as in A.

