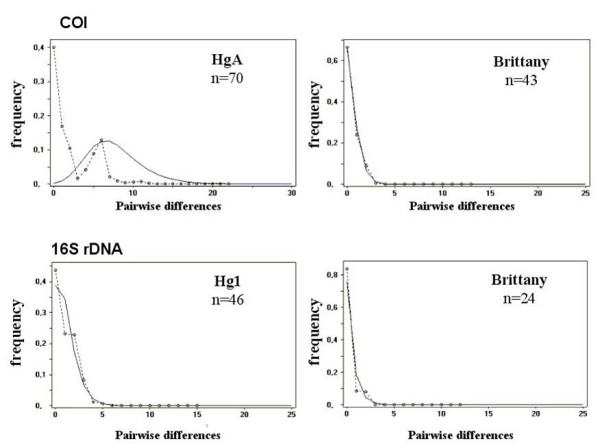
Figure 6.

Mismatch distribution of substitution differences between pairs of individuals from Brittany for 16S rDNA and COI genes. The observed frequency is given as a dotted line. The expected distribution under a growth-decline model determined using the DNASP v3.5 program [54] is represented by a continuous line.
