
Figure 5.
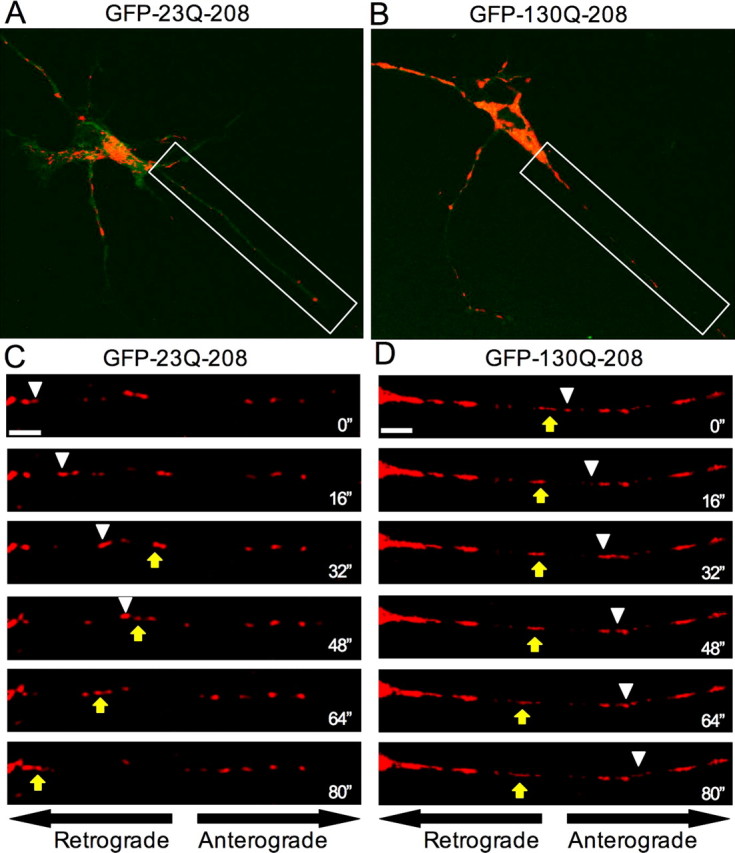
Soluble N-terminal mutant htt impairs mitochondrial trafficking in neurons. A, B, Representative images of DsRed2Mito and GFP-htt expression in striatal neurons transiently transfected with GFP-23Q-208 (A) or GFP-130Q-208 (B). Only neurons showing diffuse htt without visible aggregates were selected for analysis of mitochondrial transport. C, D, White framed rectangles highlight the region presented in the time-series panels below (C, D) and in the full 5 min sequences (supplemental Movies 1, 2, available at www.jneurosci.org as supplemental material). Both anterogradely (white arrowheads) and retrogradely (yellow arrows) moving mitochondria tended to travel longer distances over shorter periods of time in neurons expressing wild-type N-terminal htt fragments compared with those in neurons expressing soluble mutant htt N-terminal fragment. Scale bars, 5 μm.