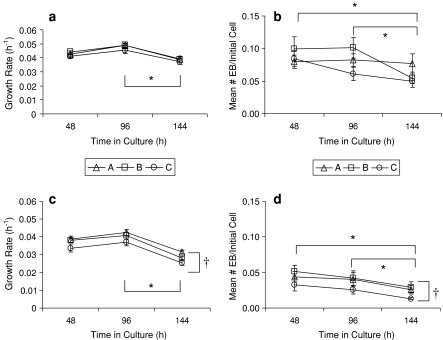
Fig. 4.
The effects of three KOSR lots (A, B and C) and time in culture on the growth rates and EB yields of R1 cells: a growth rate in 5% KOSR, b EB formation in 5% KOSR, c growth rate in 15% KOSR and d EB formation in 15% KOSR. Values shown are mean ± SEM (n = 8). *Denotes a significant decrease at 144 h. †Denotes significant differences between KOSR

