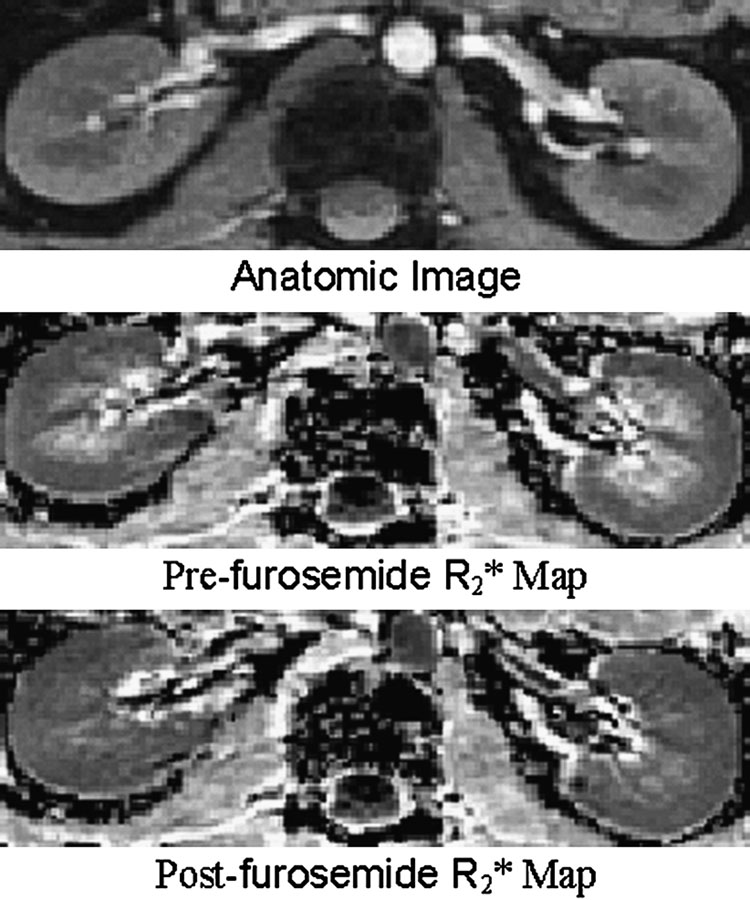
Figure 3.
Representative images obtained with the mGRE sequence in a healthy subject pre- and post-furosemide administration. Top is the anatomic image of the kidney (first image of the series of 16 GRE images). Middle is the pre-furosemide R2* map, and at the bottom is the post-furosemide R2* map obtained at the same slice location. The windowing was held constant for both the maps. Note that the medulla appears much brighter than the cortex on the pre-furosemide R2* map, but looks close to isointense compared to the cortex on the post-furosemide R2* map, implying improved oxygenation on the latter. (From Li LP, Vu AT, Li BS, Dunkle E, Prasad PV. Evaluation of intrarenal oxygenation by BOLD MRI at 3.0 T. J Magn Reson Imaging. 2004 Nov;20(5):901-4; with permission)

