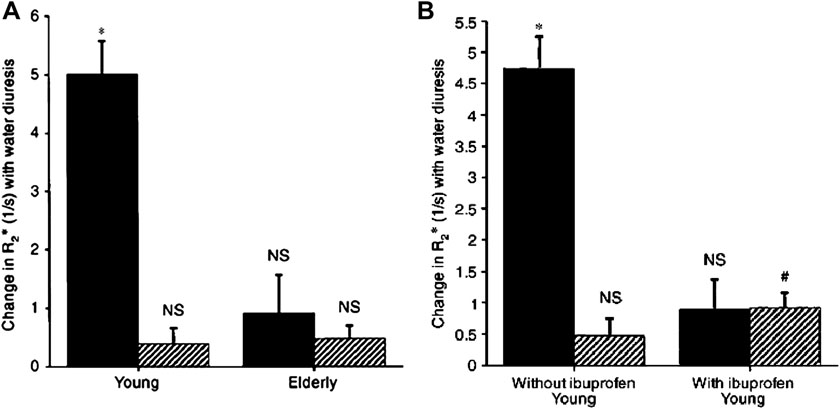
Figure 5.
(A): Comparison of changes in R2* in response to water load in 9 young and 9 elderly subjects. (B): Comparison of changes in R2* in response to water load in 6 young subjects with and without cyclooxygenase inhibition with ibuprofen. Symbols are: ( ) medulla; (
 ) cortex. Columns are mean ± SEM. NS implies not significant, * implies p<0.01, and # implies p<0.02‥ (From Prasad PV, Epstein FH. Changes in renal medullary pO2 during water diuresis as evaluated by blood oxygenation level-dependent magnetic resonance imaging: effects of aging and cyclooxygenase inhibition. Kidney Int. 1999 Jan; 55(1):294-8; with permission.)

