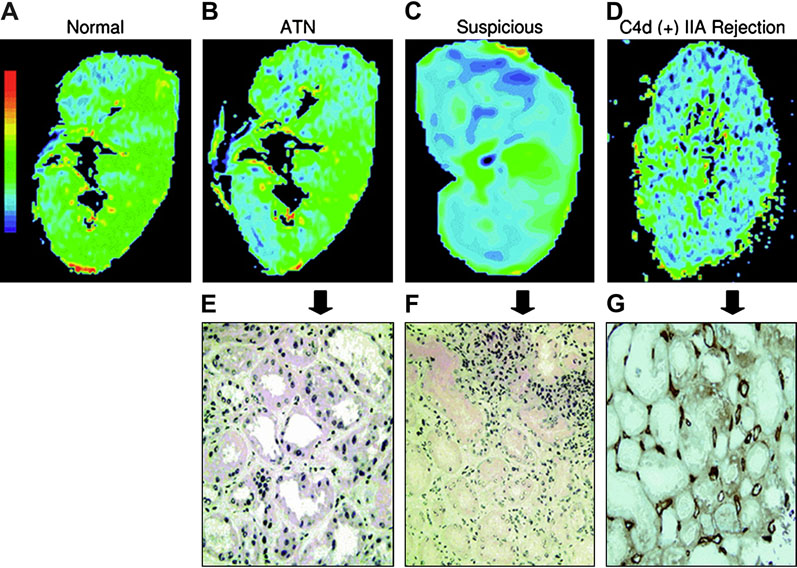
Figure 6.
BOLD-MR color R2* map of coronal sections and corresponding histopathological findings. (a–d) Color R2* maps in the coronal planes, of normal kidney allograft and transplants with acute dysfunction. Blue represents the lowest R2* value (lowest deoxyhemoglobin concentration), and green, yellow, and red show increasing R2* values. Color map scale is similar in all figures. (e–g) Pathology sections (20 × magnification) of the corresponding kidney with ATN (e), suspicious for rejection (f) and C4d (+) IIA rejection (g with insert). (From Djamali A, Sadowski EA, Samaniego-Picota M, Fain SB, Muehrer RJ, Alford SK, Grist TM, Becker BN. Noninvasive assessment of early kidney allograft dysfunction by blood oxygen level-dependent magnetic resonance imaging. Transplantation. 2006 Sep 15;82(5):621-8; with permission.)

